
Aditi Goyal, Genetics & Genomics, Statistics ‘22
Abstract:
Non-Beta structures are nucleic acid structures that do not follow the classic beta-helix structure described by James Watson, Francis Crick, and Rosalind Franklin [1]. R loops are a class of non-B structures and are estimated to occur across 5 percent of the human genome [1]. R loops occur when RNA strands bind to DNA, creating a DNA/RNA hybrid [1]. These structures have been implicated in several biological mechanisms, including gene regulation and DNA replication [1]. In order to further understand the purpose of R loops and their impact, one must first understand where they occur [2]. To study the location of these structures, scientists employ a technique called DRIP sequencing ([DNA/RNA ImmunoPrecipitation sequencing]) [1]. This technique utilizes the standard immunoprecipitation coupled with high throughput sequencing protocol that is commonly used in ChIP seq studies [1]. As with any sequencing technique, several modifications have been made, resulting in various types of DRIP seq protocols [1]. This literature review aims to summarize some of the more common techniques employed in R loop research [2]. This review relies on a compilation of primary research papers that document the development of these techniques [3]. It discusses the variations of each technique and identifies situations where one method may be preferred over another [4]. Further, it provides insight into the drawbacks of each method and identifies areas of improvement for these types of sequencing studies [4]. Finally, this review also highlights further areas of research inspired by the data generated from DRIP seq experiments [5].
Introduction
In all organisms, maintaining genome stability is critical for biological function. Structures that threaten the overall stability and structure of an organism’s genome, therefore, are of high importance in the scientific community, as they may provide insight into several biological mechanisms. R loops are no exceptions. R loops are DNA/RNA hybrids that are formed when an RNA strand hybridizes onto a double helix DNA molecule [1]. This hybrid structure displaces one of the two DNA strands, creating the ‘loop’ structure. This structure does not follow the classic beta-helix structure described by Watson, Crick, and Franklin, and is therefore known as a type of non-B DNA structure. Non-B DNA structures are somewhat common, occurring in approximately 13 percent of the human genome [2]. R loops occur across 5 percent of the genome. These structures disrupt DNA regulation and maintenance and are therefore a critical topic of study for understanding gene regulation [2, 5, 6].
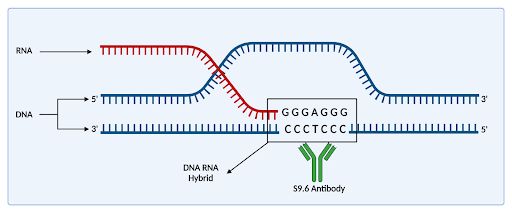
Figure 1: 3 stranded structure describing an R loop. RNA strand, illustrated in blue, displaces the purple DNA strand, creating a loop structure. The s9.6 antibody, illustrated in green, recognizes DNA/RNA hybrids.
Understanding the genomic context of a regulatory element can provide insight into its function. Therefore, a key question when studying R loops is asking where these loops form along the genome. Several studies have aimed to characterize where R loops form along the genome [3-5]. In general, R loops are not sequence-dependent. They tend to prioritize location relative to the gene body, as opposed to a specific sequence pattern. These structures seem to occur before the first intronic region of a gene. Studies also show that these structures target promoter regions within a gene. These conclusions further support the idea that R loops interact more heavily with the structure of DNA, as opposed to the sequence. Specifically, R loop formation may depend on the accessibility of the DNA strand itself, as researchers have shown that R loops tend to form in unmethylated CpG islands (regions of the genome, primarily near promoters, that contain a large number of “CG” dinucleotide repeats) [4]. The Chedin lab at UC Davis proposes the theory that R loops prevent the methylation of transcription start sites, thereby promoting the transcription of certain genes [4]. This discovery further supports the theory that R loops are regulatory elements and play a part in gene expression regulation. Of course, given the structural instability R loops cause, they are hypothesized to have positive and negative effects on overall gene regulation and maintenance.
To understand where R loops form along a genome, we need a technology that captures this hybridization and allows us to map these regions back to a reference genome. The most used methodology for this purpose is DNA-RNA immunoprecipitation sequencing or DRIP seq for short. This review aims to provide an overview of the technology, some of the commonly used modifications used in the field and highlight the potential benefits and drawbacks of the technology. Finally, this paper proposes further areas of research; DRIP seq is a critical tool for studying R loop biology and warrants the development of analytical tools designed for processing DRIP seq specific data.
DRIP seq Protocol
Like ChIP seq protocols, DRIP seq utilizes an antibody to precipitate RNA sequences that have been cross-linked to DNA sequences. Specifically, most DRIP seq protocols rely on the S9.6 antibody, due to its high specificity and affinity for DNA/RNA hybrids [7]. As a control, genomic samples are treated with RNase H before immunoprecipitation [8]. RNase H, short for Ribonuclease H, is an enzyme active in DNA replication. RNase H recognizes DNA/RNA hybrids, which occur naturally in Okazaki fragments from RNA primers, and degrades the RNA. By treating with RNase H, we can degrade R loops present in the sample, leaving genomic DNA behind. Researchers have shown that Rnase H treatment can effectively remove R loops that disrupt DNA replication mechanisms [8].
DRIP seq is coupled with high throughput sequencing and is used in conjunction with a peak calling algorithm. Peak calling algorithms identify regions of interest in the genome. Sequence reads are aligned to a reference genome, and then processed via one of many peak calling algorithms, the most common one being MACS (Model-based Analysis of Chip Seq data). MACS analyzes the aligned data, and identifies “peaks”, or areas where there is a significant pileup of sequenced data. These peaks indicate areas of interest, and inform the researcher where their target region is. At its core, DRIP seq performs a very essential task of informing researchers where R loops occur. However, given the intricacies of this research, there are several drawbacks and assumptions involved in using DRIP seq.
bisDRIP seq
One major drawback of DRIP seq is its lack of resolution. The s9.6 antibody capture technique used in DRIP seq successfully identifies DNA/RNA hybrids. However, these regions are often too broad, as DRIP seq cannot identify which regions of DNA directly bind to RNA, and which regions of DNA are flanking regions [9]. This resolution is important for understanding how R loops impact promoter regions, which are sequence-specific entities [9, 10]. Additionally, defining the boundaries of an R loop can help us understand which elements of a gene R loops directly interact with. bisDRIP seq ([bisulfite DRIP sequencing)] was developed as a method to study where R loops localize within promoter regions [9]. Bisulfite treatment is a commonly used mutagenesis technique. This chemical treatment mutates unprotected cytosines into uracil nucleotides. In this application, researchers target the ‘open’ cytosines, which are present on the displaced DNA strand. Any cytosines on the displaced DNA strand mutate into uracils. In contrast, the cytosines present in DNA that are part of the DNA/RNA hybrid are protected from the bisulfite because they are bound. As a result, these cytosines remain unchanged. Based on the region of DNA mutated on the single strand, we can define the boundaries of the DNA/RNA hybrid. The developers of this method, a team at Cornell, discovered that R loops generally have boundaries defined by the transcription start site and the first exon-intron junction [9]. This implies that R loops are variable in length, depending on the length of the first exon.
While this technique offers high resolution, it also relies on the presence of cytosines in the region. R loops have been shown to localize in regions with high GC content [4], but in situations where this is not the case, this resolution may not be attained simply due to a lack of cytosines. Another possibility is that even in a GC-rich region, the displaced strand may be more G rich, as opposed to C. If there are no or few open cytosines on the open strand, this technique will not work. Further, chemical changes of the structure of DNA can introduce great instability and can therefore make this technique difficult to implement.
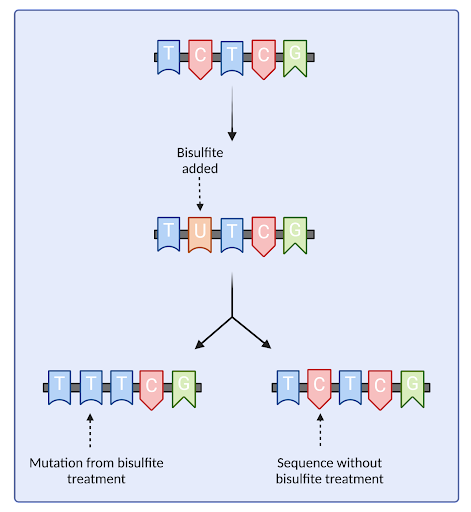
Figure 2: Bisulfite treatment will convert open cytosinecytocines to uracil, allowing us to track which regions were affected by the treatment.
s1-DRIPseq
S1-DRIPseq introduces modifications to the DRIP seq protocol that dramatically improve yield and minimize background noise. The DRIP seq protocol typically uses sonication as a method of shearing DNA fragments before immunoprecipitation. However, this method is grossly ineffective at capturing R loops, as the force of sonication disrupts most R loops present [11]. Specifically, sonication shears the DNA/RNA bond, allowing the RNA strand to be displaced and the DNA strand to re-anneal to its sister strand. S1 nuclease is an enzyme that targets single-stranded nucleic acids, aka the displaced DNA strand. By digesting this single strand, researchers can target the single strand fragments based on size. Moreover, digestion of the single strand increases the stability of the DNA/RNA hybrid, allowing for more of the regions to survive immunoprecipitation. By preserving these R loops, researchers were able to identify approximately 800 novel R loop sites in Saccharomyces cerevisiae, a common model organism for studying R loop biology [11, 12]. Due to its targeted nature, this method also greatly reduces unwanted noise, further improving the resolution of peak calling methods [11].
DRIP seq Analysis
Much like ChIP seq, the next step after DRIP sequencing and alignment is to utilize some type of peak calling program. These programs are designed to identify regions that have a statistically significant number of reads aligning to that region. This metric is referred to as the “pileup”. Significant pileup indicates that an R loop is present in this region. MACS2 [Model-based Analysis of ChIP seq] has become an industry-standard in analyzing peak data. Given that the protocol for DRIP seq closely resembles ChIP seq, the same program has been utilized to analyze DRIP seq experiments.
Once peaks have been called, they need to be annotated. There exist several types of peak annotators, designed for “universal” data. They utilize different features of the genetic data to create functional annotations. UROPA ([Universal RObust Peak Annotator)] allows users to target any type of genomic feature, along with strand specificity, and anchor positions relative to the feature [13]. Similarly, programs PAVIS and HOMER are common peak calling and annotation methods but were not specifically designed for DRIP seq data [14, 15].
To address this need for a DRIP seq specific annotation platform, a team at the University of Bologna developed DROPA ([DRIP Optimized Peak Annotator)] [16]. There are several minor differences between DROPA and the three other peak annotators listed above. The primary difference is that DROPA allows for multiple gene annotations. Recall that R loops can be very long and can span over several gene features. DROPA takes this into account and allows for longer annotations than most peak callers that use gene features as anchor points [16]. While DROPA does not provide antisense peak annotation, it does drastically reduce the number of false-positive annotations to under 7 percent [16].
Drawbacks and Discussions
DRIP seq is a critical part of studying R loops. However, the process is not perfect. There are major drawbacks to using DRIP seq in R loop identification. Firstly, the s9.6 antibody has been shown to bind to RNA/RNA hybrids, in addition to DNA/RNA hybrids [17]. Additionally, when S9.6 does identify DNA/RNA hybrids, it has been proposed that there is inherently a bias in which DNA/RNA hybrids S9.6 identifies. Research points to a potential nucleotide composition bias within the antibody [18]. Interestingly, a common pattern identified was polyA or polyU. Given that R loops are GC rich, an antibody that is biased towards AU binding indicates that this antibody may result in false positives and false negatives.
Further, the S9.6 antibody only requires six nucleotides of DNA/RNA binding to identify a “hybrid” [19]. This has positive and negative implications. Only requiring six nucleotides allows this antibody to capture the smallest of R loops, which is important for studying smaller promoter regions. However, it also means that non-R loop structures may be misidentified as R loops. This hyperaffinity, combined with the antibody’s ability to identify RNA/RNA hybrids, implies that this method may identify small interfering RNA complexes along with R loops.
Another major issue with DRIP seq is the quantitative analysis. Firstly, there is no peak caller for DRIP seq data. As of now, researchers can use MACS2, which was designed for ChIP seq data, or can build a makeshift peak caller. This lack of a standardized method causes large variance between how data is analyzed across different experiments and likely leads to varying results. Additionally, peaks identified with MACS2 may not be an accurate representation of the in-vivo conditions. While ChIP seq and DRIP seq follow very similar protocols, we cannot assume that the data looks the same.
Furthering this point, the analysis of the peaks themselves is somewhat subjective. There is no set standard for what is considered a “peak” when analyzing DRIP seq alignment data. As such, different parameterization with different peak calling methodologies can result in drastically different R loop maps. This lack of standardization is rampant in current research. To combat this problem, a team at Nanjing University has compiled a database of R-loop experiments “R-loopBase”, which features over 11 different technologies, and billions of gene annotations [20]. This database is a fundamental first step towards standardization, and yet it highlights the necessity of a standardized protocol, as it features so many variants in the field.
This issue extends beyond the analytical component to the preparation of DRIP seq samples as well. As discussed earlier, sonication is a common method of shearing double-stranded DNA during sample preparation. However, if an endonuclease is used, it can drastically alter the results. The Halasz team in Hungary investigated several variables in the DRIP seq lab protocol and concluded that using restriction enzyme digestion overrepresents longer R loops as compared to those in open reading frames [21]. They propose a standardized preparation method to help normalize physical variation between datasets [21].
Conclusion
R loops remain an elusive subject in molecular biology. They have often been characterized as the double-edged sword of gene regulation. They have been identified as critical components of transcription termination, with evidence pointing to catastrophic results if R loops are removed. And yet, they are undoubtedly a key player in genomic instability and have also been linked to Fragile X syndrome, a genetic condition that can cause intellectual disabilities and cognitive impairment [22]. There is also some evidence to suggest that R loop formation is a contributing factor in Huntington’s disease, breast, ovarian, and colon cancer, as well as Prader’s Willi Disease [23]. Tools like DRIP seq allow us to understand how these elements interact with DNA on a genome-wide scale and provide critical insight into what types of interactions are occurring. Given the inherent entropy of in vivo cell systems, standardization across DRIP seq methodologies is critical, in hopes of reducing noise and improving statistical significance in peak calling algorithms. If more reliable data can be made available, there is huge potential for applications of artificial intelligence in this field. R loop prediction would save researchers countless hours and resources, by potentially allowing them to forgo DRIP seq methodologies and rely on a predictive neural network to tell them whether an R loop is expected to be present at the loci of interest. This pattern detection program could also elucidate the mechanisms behind why R loops tend to form in certain hotspots over others. However, to make these discoveries, we must first develop tools and standards across the entire DRIP seq protocol, both in the lab and in analysis. R loop biology has boomed across the last decade and will only continue to grow. As such, this field demands that we invest the resources in developing tools specific to studying R loops and other non-B DNA structures.
References:
- Santos-Pereira, & Aguilera. Nat Rev Genet 16, 583–597 [2015].
- Wilfried et al. Nucleic Acids Research, Volume 49, Issue 3, 2021.
- Malig et al. J Mol Biol. 2020
- Ginno et al. Mol. Cell, 45 [2012], pp. 814-825
- Skourti-Stathaki & Proudfoot. Genes Dev, [2014], pp. 1384-1396
- Richard & Manley J Mol Biol. 2017;429[21]:3168-3180.
- Boguslawski et al. [1 May 1986]. Journal of Immunological Methods. 89 [1]: 123–30.
- Zhao et al. [2018]. EMBO reports, 19[5], e45335.
- Dumelie & Jaffrey [2017, October 26].
- Chédin. [2016]. TIG, 32[12], 828–838.
- Wahba et al. Genes & development, 30[11], 1327–1338.
- Chan et al. [2014]. PLoS genetics, 10[4], e1004288.
- Kondili et al. Sci Rep 7, 2593 [2017].
- Huang et al. [2013]. 29[23], 3097–3099.
- Homer. Homer Software and Data Download.
- Russo et al. BMC Bioinformatics 20, 414 [2019]
- Hartono et al. J Mol Biol. 2018 Feb 2;430[3]:272-284.
- Konig et al. PLoS ONE 2017, 12, e0178875.
- Phillips et al. 2013, 26, 376–381.
- Ruoyao et al. Nucleic Acids Research, Volume 50, Issue D1, 7 January 2022, Pages D303–D315
- Halász et al. Genome research vol. 27,6 [2017]: 1063-1073.
- Groh et al. PLoS Genet. 2014 May 1;10[5]:e1004318.
- Richard & Manley. Journal of molecular biology vol. 429,21 (2017): 3168-3180.