
The effects of temperature and light on plasmodesmal callose deposition in Arabidopsis thaliana
Introduction
Climate Change and Agriculture
Recent anthropogenic changes to Earth’s climate have yielded undesirable consequences upon humans. Perhaps the most immediately threatening of these is that of global warming, resulting from the production of greenhouse gasses like carbon dioxide. Studies show that global warming results in higher average global temperatures, more intense weather events, and uncertainty in overall future climate conditions. This uncertainty places strain on crucial fields like agriculture, a practice that is already strained by current global and societal conditions. For example, the human population is the largest it has ever been, with millions going hungry every year and the population continuing to grow rapidly, both of which increase demand for agricultural production [1]. Further, agriculture is feeling stress due to climate change already: warmer temperatures and extreme weather events threaten the crops themselves and stand as a only fraction of the changes to come [2].
To answer the question, “how will certain environmental changes affect crops?” we must answer the question, “how might certain environmental changes affect key plant structures and molecules?” Testing these hypotheses to understand how plants operate on their most fundamental level — that is, studying the function of cellular elements shared by all plants — builds a base of knowledge with a wide range of applications. This is both the impetus and purpose behind our research question: given its role in cell defense, understanding the relationship between callose and temperature is important in determining how plants will react to future climate-change threats and may inform food producers' decisions on species selection, breeding, and genetic engineering. Finally, the range of application for research is further amplified if it is conducted on a robust model organism.
Arabidopsis thaliana
Arabidopsis thaliana, commonly called “thale cress,” is a popular model organism across scientific research for several reasons. First, it is easy to grow and has a short life cycle. Seeds start to germinate as early as a few days after planting, which is desirable for obtaining several repeat trials in a short period of time. Second, Arabidopsis thaliana (A. thaliana) has a fairly small and fully-sequenced genome. This means research on A. thaliana can inform decisions on important genetic engineering technology. Lastly, A. thaliana is a part of the taxonomic family Brassicae, also known as the mustard family, from which many important modern crops have been bred. As such, research on Arabidopsis has close application to many of these crops, including sprouts, cabbage, and broccoli. [3]. For these reasons, A. thaliana was selected as the model organism for this experimental research.
Callose and Plasmodesmata
Plasmodesmata are crucial cellular structures found in all plants, including A. thaliana, that act as channels connecting plant cells. They reside in the cell wall and, more specifically, connect the cytoplasm of two cells. Plasmodesmata are essential structures because they allow for cellular communication and molecular transportation. By varying in permeability, they enable or inhibit the intercellular passage of various molecules. Small molecules, such as sugars, ions, and other essential nutrients or chemicals, move freely between cells through the cytoplasmic sleeve. However, large, complex molecules such as proteins or RNA species require similarly complex cell-wall changes in order to allow their passage [4].

Callose, a β-1,3 glucan polysaccharide, regulates the permeability of the plasmodesmata. When callose is deposited at the edge of the cell wall, it pushes on the plasma membrane lining and pinches it towards the neck of the endoplasmic reticulum—a cellular structure important for transportation—closing the channel and preventing the passage of materials. When callose is removed, the opposite effect is observed and the channel is left in an open state [5]. Generally, increased callose deposition is a response to stress, be it biotic (pest, pathogen, etc.) or abiotic (temperature, heavy metals, injury, etc). This is because closing the channels between cells is largely a beneficial reaction. It prevents the hijacking of these transportation channels by a pathogen, the penetration of heavy metals further into tissue, and the loss of water that is crucial for cell stability—all threats that are very relevant to producers of agriculture [6].
However, more specific relationships between environmental stressors and callose responses have been observed. Past studies show that a sudden increase in temperature (also called a heat shock or “HS”) may increase or decrease callose deposition depending on the plant species, intensity of the heat shock, duration of the heat shock, part of the plant studied, and more [7, 8]. Finally, the exact mechanism and purpose behind this heat-induced callose response is poorly understood and further research is needed.
Study Aims
As previously mentioned, the broad question to be answered is, “how will certain environmental changes affect key plant structures and molecules?” Deriving from this question, this study examines how changes in temperature and light affect the deposition of plasmodesmal callose in A. thaliana. While the importance of temperature as an environmental stressor has been discussed, light became an environmental factor of interest for this study for several reasons. First, light is a key player in plant metabolism, being a source of electrons for photosynthesis. Second, light is closely related to temperature and climate change: light availability correlates with weather conditions such as temperature and cloud cover, both of which will fluctuate with future climate changes. Finally, unexpected laboratory conditions (that will be discussed further in methods) came into play: while there was a day and night cycle for the initial growth/control temperature room, experimental temperatures could only be tested in total darkness, making light another important variable to examine.
Based on previous literature, especially Liu et al. 2022, and current understanding of plant anatomy, three hypotheses were created and tested. First, we hypothesized that plants given a Heat Shock (HS) of 28ºC for 24 hours would experience more callose deposition than that of controls at 22ºC. Second, we hypothesized that plants given a HS at 28ºC for 24 hours followed by a Cold Shock (CS) at 4ºC for 24 hours would experience more callose deposition than both controls and HS without CS. Third, we hypothesized that plants grown in light and dark would not have a significant difference in callose deposition.
Methods
Preparing Arabidopsis thaliana seedlings
Col-0 A. thaliana seeds in an Eppendorf tube were sterilized under a fume hood. Using a Gilson pipette, they were washed for 1 minute in 70% ethanol, 4 minutes in sodium hypochlorite solution with 8% available chlorine, and finally 4 times in distilled water. The seeds were then stratified at 4ºC for 48 hours to encourage synchronized germination.
A. thaliana were then planted into a petri dish coated with a solidified liquid media. To make the media, a 400ml bottle was filled with 1.72 grams of basal salt, 4 grams of phytoagar, 4 grams of sucrose, and deionized (DI) water up to 350ml. The pH was adjusted to 5.8 with KOH solution before filling to 400 ml. The solution was then sterilized by autoclaving the bottle at 121ºC for 20 minutes. Finally, 10 square petri dishes were each filled with 40ml of the liquid solution.
After the media solidified at the bottom of the plate, A. thaliana seedlings were placed directly on top of the media. Each plate had roughly 2 rows of 10 seeds, making 20 seeds total, spaced 1 centimeter apart from each other horizontally as “seed groups.” Each seed group contained roughly 1-2 seeds. After planting, the lid of the petri dish was replaced, and micropore tape was applied around the edge of the plate, securing the seal between the top and bottom lids. Micropore tape allowed for gas exchange but deterred pathogens such as fungi or bacteria that could harm the plant. After sealing, the plates were ready to be placed in the grow room.

Growing Arabidopsis thaliana seedlings
Regardless of the treatment, all seedlings were grown for 5 days in a control growth room set to 22ºC and containing a light cycle with 16 hours of light and 8 hours of darkness. 5 days is just enough time for seedlings to start to grow.
While some of the plates were subjected to the day and night cycle, others were covered with a cardboard box to create darkness for the 5-day initial growth period: a control group for this light variable. These were considered Treatments L (light) and D (dark) respectively. Temperature control plates were left in the growth room at the control temperature for the full 7 days, both for Treatments L and D.
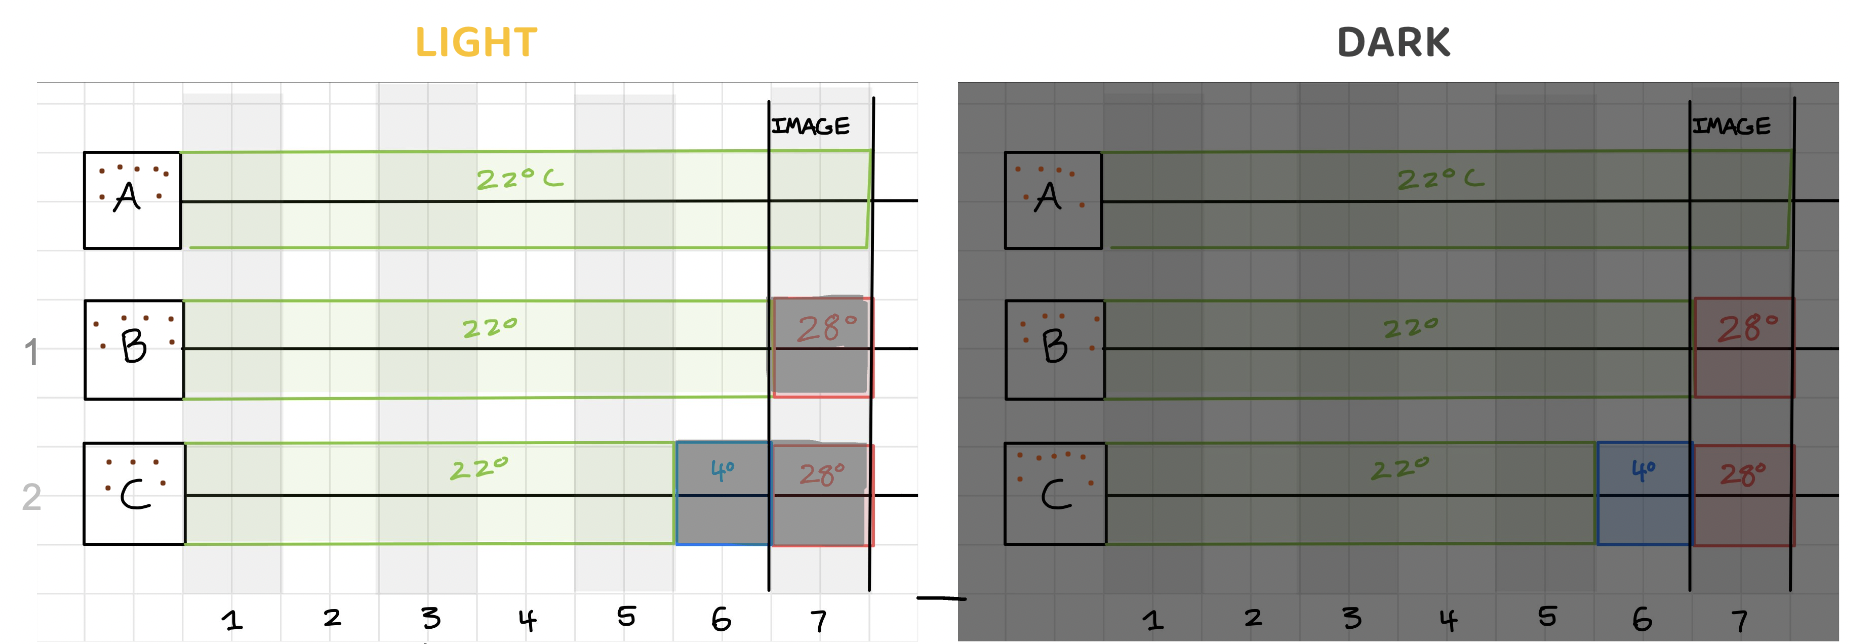
After 5 days, some experimental temperature plates were moved to a cold room at 4ºC for 24 hours. This cold room was in constant darkness except for brief windows when the door was opened to retrieve plates and the lights were turned on. After 24 hours in the cold, these same plates were then moved to an incubator for 24 hours at 28ºC (which was also in constant darkness except for during retrieval). This was considered Treatment 3 (and “C” on the diagram below). Other plates stayed at control temperature until Day 6, skipping the cold room, and then moved to the incubator for 24 hours at 28ºC. This was considered Treatment 2 (and “B” below). The rest of the plates were left in the control room for the full seven days: this was considered Treatment 1 (and “A” below). All plates, regardless of Treatment, were ready to be imaged by Day 7.
Imaging Arabidopsis thaliana seedlings
Between 5 and 10 Arabidopsis seedlings were placed upon a glass microscope slide with 0.05% (w/v) aniline blue dye solution. The seedlings were left for 10 minutes to allow the dye to soak into the leaves. Then, the slides were placed under a microscope, where normal light was used to find a leaf before being turned off and replaced by fluorescent light. The aniline blue dye attached to the callose deposits and made them glow under fluorescent light, showing up as small dots around the plasmodesmata that were big enough to count. Images were taken with an iPhone attached to a microscope-phone lens adapter, and the callose in each image was counted using the program ImageJ, selecting at under prominence 25. Occasionally, maxima were removed from the final count when they were outside of the frame of the microscope on the black part of the image and not actually deposits of callose (see Figure 5). However, no such judgment was made on anything within the frame of the microscope, even if a maximum did not seem to land on a deposition.


Statistical Treatments
R Studio was used to run statistical tests. T-tests were used for comparing two treatment means at a time, while ANOVA f-tests were used for comparisons involving more than one treatment and Tukey’s HSD Post-Hoc applied to further analyze the ANOVA results.
Results
Light, Hypothesis 1: Heat Shocks Increase Callose Deposition
The majority of trials across both the Light and Dark groups supported Hypothesis 1, that plants given a Heat Shock at 28ºC for 24 hours would experience more callose deposition than that of controls. Plants that were given a Heat Shock had significantly higher average callose deposition, with p-values below the standard significance level of 0.05.
Plants in the Light group grew well and were easy to image, producing three full trials of each treatment and 10 images per treatment. Trial 1 showed a fairly high range of callose deposits across both treatments and contained some of the highest single image callose levels across all of the data in this project. Further, given the number of high quality images from this trial, each picture was from a unique seedling and the final callose deposit count was an average of 2-5 images from different parts of the leaf. However, given later time and imaging restrictions, using an average of 2-5 images was only possible for this specific Trial (Light, Hypothesis 1, Trial 1). Regardless, performing a t-test revealed a significant difference between the two means, with a p-value of 0.01147 < 0.05 and Treatment B having the higher average callose deposition.
Trial 2 had a couple large outliers, but otherwise showed low within-group variability in callose counts for each treatment. Performing a t-test revealed a significant difference between the two means, with a p-value of 0.01115 < 0.05 and Treatment B having the higher average callose deposition.
Trial 3 showed the greatest difference between Treatment A and Treatment B callose deposition values. Trial 1 had a difference of 83.7 and Trial 2 had a difference of 104.6, while Trial 3 had a difference of 162. Performing a t-test revealed a significant difference between the two means, with a p-value of 0.000005568 < 0.5 and Treatment B having the higher average callose deposition. This is the strongest evidence supporting Hypothesis 1 and is supported with the lowest p-value.

Figure 7. This boxplot compares the plasmodesmal callose deposition between Treatment A (control) and Treatment B (Heat Shock for 24 hours at 28ºC). Performing a t-test revealed a significance between the two means, with a p-value of 0.01147.

Figure 8. This boxplot compares the plasmodesmal callose deposition between Treatment A (control) and Treatment B (Heat Shock for 24 hours at 28ºC). Performing a t-test revealed a significance between the two means, with a p-value of 0.01115.

Figure 9. This boxplot compares the plasmodesmal callose deposition between Treatment A (control) and Treatment B (Heat Shock for 24 hours at 28ºC). Performing a t-test revealed a significance between the two means, with a p-value of 0.000005568.
Dark, Hypothesis 1: Heat Shocks Increased Callose Deposition
In contrast to the Light group, plants that grew in the dark were more difficult to image. Two trials were produced, but they only yielded 5 usable pictures per each. Despite this difficulty, Hypothesis 1, that plants given a Heat Shock at 28ºC for 24 hours would experience more callose deposition than that of controls, was supported by Trial 1. Plants that were given a Heat Shock had significantly higher average callose deposition, with p-values below the standard significance level of 0.02558 < 0.05. In Trial 2, while Treatment B had higher average callose deposition, a t-test revealed no significance difference between these two means, with a p-value of 0.4353 > 0.05.

Figure 10. This boxplot compares the plasmodesmal callose deposition between Treatment A (control) and Treatment B (Heat Shock for 24 hours at 28ºC). Treatment B had higher average callose deposition (167.8 > 129.2), and performing a t-test revealed a significance between the two means, with a p-value of 0.02558.
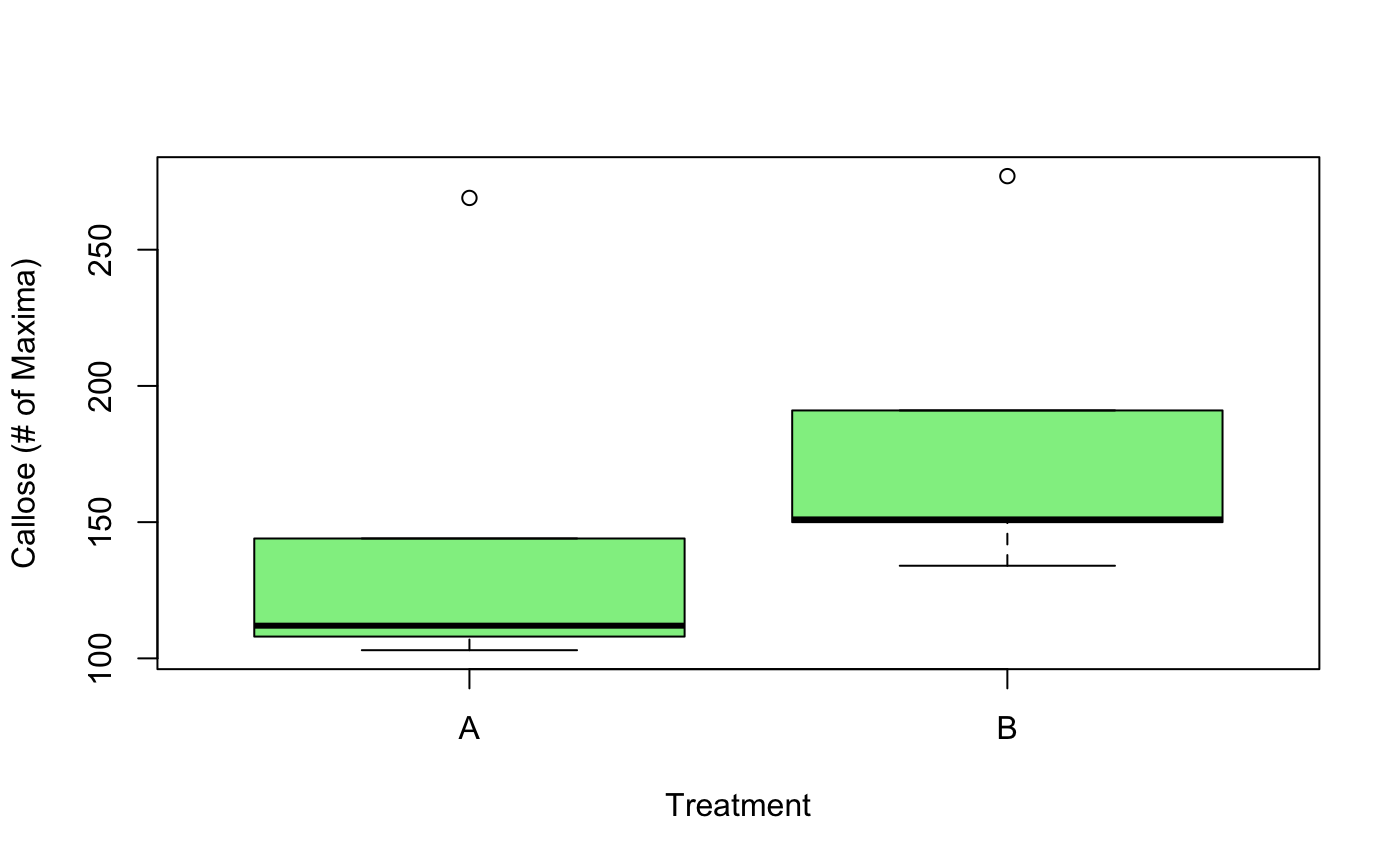
Figure 11. This boxplot compares the plasmodesmal callose deposition between Treatment A (control) and Treatment B (Heat Shock for 24 hours at 28ºC). Treatment B had higher average callose deposition (180.6 > 147.2), but performing a t-test did not support a significant difference between the two means, with a p-value of 0.4353.
Hypothesis 2: Inconclusive, Need More Data
Hypothesis 2, that plants given a Heat Shock at 28ºC for 24 hours followed by a Cold Shock at 4ºC for 24 hours would experience more callose deposition than both control and Heat Shock without Cold Shock, had less conclusive results than Hypothesis 1. Due to time limitations, data was only collected under regular Light conditions, none for Dark, with only one repetition of Light data collected. The only trial of data collected did not show a significant difference between the mean callose deposition of the control and Treatment C. However, the mean callose deposition for Treatment C (HS and CS) was found to be significantly lower than that of Treatment B (just HS). Observationally, there does seem to be a response of interest for this treatment underlying the inconclusive data. Compared to control, means for Treatment C had high within group variability, with extremely large values and extremely small values. This is represented visually in the box plot.

Figure 12. This boxplot compares the plasmodesmal callose deposition between Treatment A (control) and Treatment C (24 hour Cold Shock at 4ºC followed by 24 hour Heat Shock at 28ºC). Treatment C had lower average callose deposition, but performing a t-test revealed no significance between the two means, with a p-value of 0.8897.
Hypothesis 3: Light Conditions Had No Effect on Callose Deposition
Finally, Hypothesis 3, that plants grown in light and dark would not have a significant difference in callose deposition, was supported. There was no significant difference in the mean callose deposition between Light and Dark control plates (grown for 7 days in total light/dark respectively). The same was true between Light and Dark plates of Treatment B (Heat Shock for 24 hours at 28ºC), where Light plates only experienced darkness during the 24 hour heat shock and Dark plates experienced Darkness for the full seven days.

Figure 13. This boxplot compares the plasmodesmal callose deposition between Light and Dark control plates. Light had an average callose deposition of 123, while Dark 138.2. However, performing a t-test revealed no significance between the two means, with a p-value of 0.3883.
Figure 14. This boxplot compares the plasmodesmal callose deposition between Light and Dark plates for Treatment B. Light had an average callose deposition of 227.6, while Dark 174.2. However, performing a t-test revealed no significance between the two means, with a p-value of 0.1577.
Discussion
To summarize, this study placed A. thaliana seedlings under environmental stress to observe and compare the responses of callose deposition in the plasmodesmata. Hypothesis 1 was well supported across the data: plants given a Heat Shock at 28ºC for 24 hours experienced more callose deposition than that of controls. Hypothesis 2 was not supported: that plants given a Heat Shock at 28ºC for 24 hours followed by a Cold Shock at 4ºC for 24 hours did not experience more callose deposition than both control and just Heat Shock in enough trials to be conclusive. However, limitations restricted the number of trials and there does seem to be an effect of interest to be explored further. Finally, data supported Hypothesis 3: plants grown in light and dark did not have a significant difference in callose deposition.
Hypothesis 1 was informed by Liu et al., 2022, which found that heat shocks correspond with increased callose deposition in cells at the root tips of A. thaliana seedlings. The findings of this study supports this response at a different part of the plants – the leaves. Now with a basic relationship and response observed, there is room to explore how the response changes under different circumstances that are perhaps more realistic and applicable to agriculture. Further studies may look at different temperatures (higher than 28ºC), different exposure times (24 hours is a relatively short shock in the context of long term climate changes), other parts of the plant (cells that aren’t the leaves or the roots), older plants (fully grown as opposed to seedlings), and more. As stated before, understanding the relationship between callose and temperature under more practical agricultural settings is important in understanding how plants will react to future climate-change threats and may inform species selection, breeding, and genetic engineering decisions. Additionally, the mechanism and purpose behind this heat-induced callose response is poorly understood and something to be explored further.
Limitations
Several limitations occurred throughout the study, leading to the prioritization of repetitions for Treatment B and Hypothesis 1 over the others. The first of these difficulties involved low seed germination rates. The very first set of A. thaliana seedlings that were planted for this study showed extremely low rates of germination, with only a few seedlings across all 20 plates that could be imaged by Day 7. Many plates had no germination until close to Day 10, at which point they could no longer be imaged. Of course, no data can be collected if there are no seedlings to be imaged. One possible explanation for this was error in the seed sterilization process. As advised by Dr. Knox, if seedlings were washed for extra time in either the ethanol or the sodium hypochlorite solution, it is possible that they could have been killed. Sterilizing a new batch of seeds (and doing so more carefully) to use for a second set of plates led to normal germination rates.
The largest limitation encountered throughout this study involved imaging plants grown in darkness. Because the seedling was searching for light but had not found it yet, simulating upward growth through soil to the sunlight, the first two leaves did not grow as much as those on seedlings grown in normal light conditions. These smaller leaves were harder to image for many reasons. Firstly, observing less surface area lowered the potential to find an imageable part of the leaf. Secondly, these seedlings struggled to absorb aniline blue. Often, the cell wall outlines were visible under the fluorescent light (indicating that the magnification was correct and that epidermal cells were being observed) but since the aniline blue had not been absorbed well, the callose deposits were not glowing.
This difficulty denied countless images across trials, setting the experiment behind schedule and forcing the shift in focus to completing tests for Hypothesis 1. Using cold and heat rooms equipped with a full day and night cycle would make it unnecessary to control for light and dark, so that researchers could focus on growing plates in normal light conditions. Or, if future research is interested in studying plates under darkness, better methods for absorbing aniline blue could be explored.
Other times, the difficulty lay in physical factors other than or in addition to aniline blue difficulty: the flatness, position, or thickness of the leaf, the amount of aniline blue between the glass slide and cover slip, the obstruction of the epidermal cells by red mesophyll cells, etc.
There were further limitations in terms of data analysis. Image quality impacted ImageJ’s accuracy (its ability to pick up on true callose deposits and ignore spots that were not callose). There were several occurrences where it counted a bright spot that clearly was not callose or where it was not counting a spot that clearly was callose. Although it was often quite obvious when this would occur, other times it was not, so there would need to be a judgment threshold to make these decisions. Further, attempting to make these exemptions for each and every image by hand would have been too time consuming and was beyond the scope of the project. For this reason, no manual exemptions were made in response to bright spots for our study, but integrating manual exemptions carefully could result in more accurate data collection for a more in-depth investigation.
Looking Forward
Despite limitations restricting the breadth and depth of this study, the majority of trials supported Hypothesis 1, that Heat Shocks correlate with increased callose. This suggests a relationship between the two variables. Further research may test the reliability of this relationship and further nuances of it, such as the effect on crop yield or how the response changes under different heat conditions that are more realistic to climate change and therefore applicable to agriculture. Future studies could look at different temperatures (higher than 28ºC), different exposure times (24 hours is a relatively short shock in the context of long-term climate changes), other parts of the plant (observe cells other than epidermal and root, such as hypocotyl), older plants (fully grown as opposed to seedlings), and other model organisms.
As previously mentioned, there is great variance in the relationship between Heat Shocks and callose depending on many factors, but especially so on the species. Smith and McCully (1977) found that seedlings of Zea mays (corn), Glycine max (soybean) and Phaseolus vulgaris (common bean) displayed more callose at 20°C than at 26°C while looking at a mix of root cap and epidermal cells [8]. In contrast, seedlings of Pisum sativum (pea) and Solanum lycopersicum (tomato) displayed more callose at 26°C than at 20°C. Further, Webster and Currier (1965) and McNairn and Currier (1968) found that hypocotyls of Gossypium hirsutum (cotton) displayed more callose when heated to 40–45°C [9, 10], and Liu et al. (2022) found that seedlings of Arabidopsis thaliana heated to 30ºC displayed more callose in the root meristem cells [8]. Our own study adds to the second group of results, finding that Arabidopsis thaliana seedlings grown at 28ºC for 24 hours showed a significant increase in callose in the epidermal cells.
Many of these studies focused on agriculturally important plants (cotton, pea, tomato), possibly restricting the scale of application but giving their results an immediate and direct application to that crop. The reverse is true for Liu et al. (2022) and this study, which focused on the model organism Arabidopsis thaliana [8]. Therefore, it would be interesting to see if this relationship between heat and callose holds true for other members of the family Brassicae, especially widely-cultivated crops such as sprouts, cabbage and cauliflower. If so, investigating the specific mechanism and inner workings of this heat response for A. thaliana could unveil important insight for other plants that are in or similar to Brassicae.
Ultimately, despite limitations, the results of this preliminary study may inform genetic engineering strategies for callose in relation to temperature change, and they indicate a relationship of interest while highlighting opportunities for its application and future research.

About the Author: Jake Campo
Jake is a fourth-year Environmental Science & Management major with a minor in Professional Writing. He is also an editor for the Aggie Transcript. Jake is fascinated by the intersection between science and writing and loves delivering scientific topics in easy-to-digest ways for general audiences. In terms of Environmental Science, he is interested in a broad spectrum of topics: climate change, water resources, birds and waterfowl, trees and forests, urban nature, and much more. Outside of the Aggie Transcript, Jake is one of two co-coordinators for the Urban Tree Stewardship internship team at the UC Davis Arboretum, and he enjoys soccer and rock climbing.
Author’s Note
Over the summer I studied abroad through UCEAP at the University of Glasgow, in Scotland. Over six weeks, I was supervised by Dr. Kirsten Knox in carrying out a research project on plants and environmental stressors. The research culminated in writing this research paper to describe the project and analyze the results. We got a final grade for the study abroad program as a whole (consisting of a literature review, research presentation, and the final research paper) but we didn’t receive any feedback on the paper or get to bounce it back and forth with our supervisor to revise it. So I’d love to get input from my lovely fellow editors on how to improve it!
References
- World Health Organization. UN Report: Global hunger numbers rose to as many as 828 million in 2021. Accessed 2024. Available from: https://www.who.int/news/item/06-07-2022-un- report--global-hunger-numbers-rose-to-as-many-as-828-million-in-2021.
- Dubovitski, A. et al. 2021. Assessment of the impact of climate risks on agriculture in the context of global warming. IOP Conference Series: Earth and Environmental Science.
- Wixon, J. 2001. Featured Organism: Arabidopsis thaliana. Comparative and Functional Genomics.
- Sager, R., Lee, J. 2018. Plasmodesmata at a glance. Journal of Cell Science. 131 (11).
- Maule, A., et al. 2012. Plasmodesmata “in communicado.” Frontiers in Plant Science. 3 (10).
- Wang, B., Andargie, M., Fang, R. 2022. The function and biosynthesis of callose in high plants. Heliyon. 8 (4).
- Smith, M., and McCully, M. 1977. Mild Temperature "Stress" and Callose Synthesis. Planta. (136): 65-70.
- Liu, J., et al. 2022. Heat Stress Reduces Root Meristem Size via Induction of Plasmodesmal Callose Accumulation Inhibiting Phloem Unloading in Arabidopsis. International Journal of Molecular Sciences. 23 (4).
- Webster, D., and Currier, H. 1965. Callose: Lateral Movement of Assimilates from Phloem. Science. (150) 3703.
- McNairn, R., and Currier, H. 1968. Translocation blockage by sieve plate callose. Planta (82): 369-380.